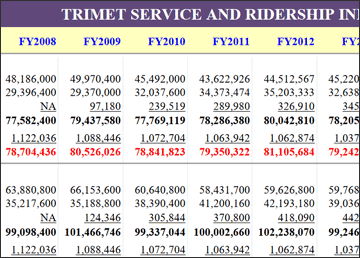
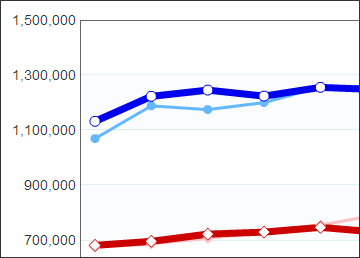
TriMet Ridership
FY2026 Boardings
July 1, 2025–June 30, 2026
-
Bus - October 2025
3,922,868
-
MAX - October 2025
1,907,762
-
WES - October 2025
12,535
-
Total - October 2025
5,843,165
FY2026 Monthly Boardings
| Bus | MAX | WES | Total | |
|---|---|---|---|---|
| Jul 2025 | 3,704,070 | 2,002,179 | 10,780 | 5,717,029 |
| Aug 2025 | 3,618,443 | 1,884,477 | 11,508 | 5,514,428 |
| Sept 2025 | 3,745,706 | 1,777,131 | 11,256 | 5,534,093 |
| Oct 2025 | 3,922,868 | 1,907,762 | 12,535 | 5,843,165 |
Current fiscal year monthly ridership estimations are subject to change until annual audit review in fall.
FY2025 Boardings
July 1, 2024–June 30, 2025
-
Bus - Annual
42,180,399
-
MAX - Annual
22,760,092
-
WES - Annual
124,008
-
Total - Annual
65,064,489
FY2025 Monthly Boardings
| Bus | MAX | WES | Total | |
|---|---|---|---|---|
| Jul 2024 | 3,363,770 | 2,065,756 | 10,296 | 5,439,822 |
| Aug 2024 | 3,502,100 | 2,041,823 | 10,934 | 5,554,857 |
| Sep 2024 | 3,402,900 | 1,886,921 | 10,140 | 5,299,961 |
| Oct 2024 | 3,812,674 | 2,095,277 | 11,730 | 5,919,681 |
| Nov 2024 | 3,394,550 | 1,871,408 | 8,930 | 5,274,888 |
| Dec 2024 | 3,302,755 | 1,768,205 | 8,589 | 5,079,549 |
| Jan 2025 | 3,462,597 | 1,760,737 | 9,933 | 5,233,267 |
| Feb 2025 | 3,130,928 | 1,629,628 | 9,140 | 4,769,696 |
| Mar 2025 | 3,557,937 | 1,877,476 | 10,059 | 5,445,471 |
| Apr 2025 | 3,775,684 | 1,919,596 | 11,308 | 5,706,588 |
| May 2025 | 3,844,671 | 1,926,398 | 11,319 | 5,782,388 |
| Jun 2025 | 3,629,833 | 1,916,867 | 10,620 | 5,557,320 |
| FY2025 Total | 42,180,399 | 22,760,092 | 124,008 | 65,064,489 |
Current fiscal year monthly ridership estimations are subject to change until annual audit review in fall.
FY2024 Boardings *
July 1, 2023–June 30, 2024
-
Bus - Annual
40,659,708
-
MAX - Annual
21,487,025
-
WES - Annual
115,935
-
Total - Annual
62,262,668
FY2024 Monthly Boardings
| Bus | MAX | WES | Total | |
|---|---|---|---|---|
| Jul 2023 | 3,182,360 | 1,824,607 | 9,780 | 5,016,747 |
| Aug 2023 | 3,404,770 | 1,848,685 | 10,994 | 5,264,449 |
| Sep 2023 | 3,316,300 | 1,726,746 | 9,260 | 5,052,306 |
| Oct 2023 | 3,478,790 | 1,935,175 | 10,252 | 5,424,217 |
| Nov 2023 | 3,132,930 | 1,869,141 | 9,513 | 5,011,584 |
| Dec 2023 | 3,055,860 | 1,872,246 | 8,260 | 4,936,366 |
| Jan 2024 | 3,439,098 | 1,271,135 | 7,770 | 4,718,007 |
| Feb 2024 | 3,662,980 | 1,403,482 | 8,799 | 5,075,287 |
| Mar 2024 | 3,469,430 | 1,797,644 | 9,513 | 5,276,587 |
| Apr 2024 | 3,515,220 | 1,920,742 | 10,648 | 5,446,610 |
| May 2024 | 3,611,270 | 1,970,072 | 11,066 | 5,592,408 |
| Jun 2024 | 3,390,700 | 2,047,320 | 10,080 | 5,448,100 |
| FY2024 Total | 40,659,708 | 21,487,025 | 115,935 | 62,262,668 |
* 2023/2024 Ridership Corrections
TriMet reports fiscal year ridership estimations to the National Transit Database (NTD). Following the reporting periods for fiscal year 2023 (July 1, 2022–June 30, 2023) and fiscal year 2024 (July 1, 2023–June 30, 2024), TriMet discovered a data error had overestimated MAX light rail ridership from May 2023 through December 2024. That led to inaccurate data totals for overall TriMet system ridership for the same time period. TriMet notified the NTD about the overestimations. NTD advised TriMet that the 2023 reporting had closed and could not be revised. For fiscal year 2024 ridership estimations, NTD accepted TriMet’s decision not to revise but to explain the discrepancies in the fiscal year 2025 Annual NTD Report. Below, TriMet is sharing the data reported to NTD and the corrected ridership estimations for MAX and TriMet overall fixed-route ridership for fiscal years 2023 and 2024.
National Transit Database Boardings
| FY2023 | FY2024 | |
|---|---|---|
| MAX | 21,822,430 | 23,332,044 |
| Fixed Route | 57,371,033 | 64,145,841 |
TriMet Corrected Boardings
| FY2023 | FY2024 | |
|---|---|---|
| MAX | 21,682,316 | 21,487,025 |
| Fixed Route | 57,295,454 | 62,262,668 |
Performance Reports
Monthly Performance Reports
2025
Passenger Census Reports
Fall 2025
Route-Level Passenger Census
Stop-Level Passenger Census
- Weekday, Sorted by Bus Stop Name PDF
- Weekday, Sorted by Location ID PDF
- Saturday, Sorted by Bus Stop Name PDF
- Saturday, Sorted by Location ID PDF
- Sunday, Sorted by Bus Stop Name PDF
- Sunday, Sorted by Location ID PDF
MAX Light Rail Passenger Census
Spring 2025
Route-Level Passenger Census
Stop-Level Passenger Census
- Weekday, Sorted by Bus Stop Name PDF
- Weekday, Sorted by Location ID PDF
- Saturday, Sorted by Bus Stop Name PDF
- Saturday, Sorted by Location ID PDF
- Sunday, Sorted by Bus Stop Name PDF
- Sunday, Sorted by Location ID PDF
MAX Light Rail Passenger Census
Fall 2024
Route-Level Passenger Census
Stop-Level Passenger Census
- Weekday, Sorted by Bus Stop Name PDF
- Weekday, Sorted by Location ID PDF
- Saturday, Sorted by Bus Stop Name PDF
- Saturday, Sorted by Location ID PDF
- Sunday, Sorted by Bus Stop Name PDF
- Sunday, Sorted by Location ID PDF
MAX Light Rail Passenger Census
Spring 2024
Route-Level Passenger Census
Stop-Level Passenger Census
- Weekday, Sorted by Bus Stop Name PDF
- Weekday, Sorted by Location ID PDF
- Saturday, Sorted by Bus Stop Name PDF
- Saturday, Sorted by Location ID PDF
- Sunday, Sorted by Bus Stop Name PDF
- Sunday, Sorted by Location ID PDF
MAX Light Rail Passenger Census
Fall 2023
Route-Level Passenger Census
Stop-Level Passenger Census
- Weekday, Sorted by Bus Stop Name PDF
- Weekday, Sorted by Location ID PDF
- Saturday, Sorted by Bus Stop Name PDF
- Saturday, Sorted by Location ID PDF
- Sunday, Sorted by Bus Stop Name PDF
- Sunday, Sorted by Location ID PDF
MAX Light Rail Passenger Census
Spring 2023
Route-Level Passenger Census
Stop-Level Passenger Census
- Weekday, Sorted by Bus Stop Name PDF
- Weekday, Sorted by Location ID PDF
- Saturday, Sorted by Bus Stop Name PDF
- Saturday, Sorted by Location ID PDF
- Sunday, Sorted by Bus Stop Name PDF
- Sunday, Sorted by Location ID PDF
MAX Light Rail Passenger Census
Fall 2022
Route-Level Passenger Census
Stop-Level Passenger Census
- Weekday, Sorted by Bus Stop Name PDF
- Weekday, Sorted by Location ID PDF
- Saturday, Sorted by Bus Stop Name PDF
- Saturday, Sorted by Location ID PDF
- Sunday, Sorted by Bus Stop Name PDF
- Sunday, Sorted by Location ID PDF
MAX Light Rail Passenger Census
Spring 2022
Route-Level Passenger Census
Stop-Level Passenger Census
- Weekday, Sorted by Bus Stop Name PDF
- Weekday, Sorted by Location ID PDF
- Saturday, Sorted by Bus Stop Name PDF
- Saturday, Sorted by Location ID PDF
- Sunday, Sorted by Bus Stop Name PDF
- Sunday, Sorted by Location ID PDF


